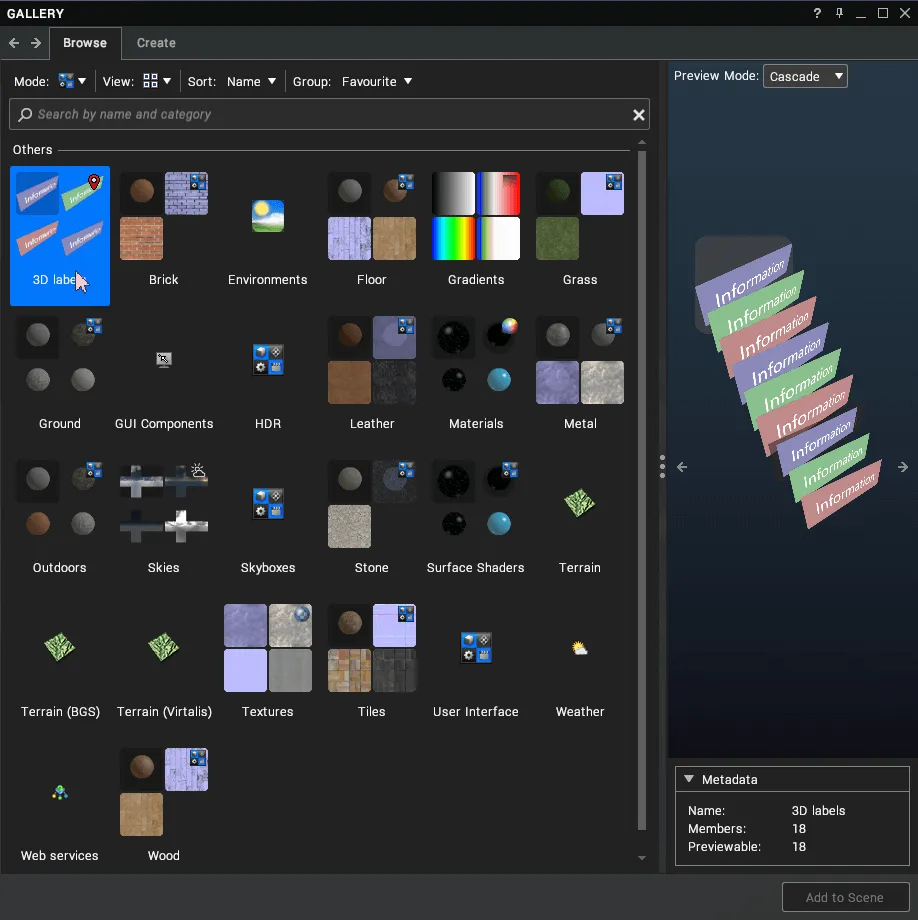
Import from major polygon, CAD modelling or 3D-scanning toolchains. An open API enables integration with any other complementary tool or data set.
Supported file types and importers
Visualise
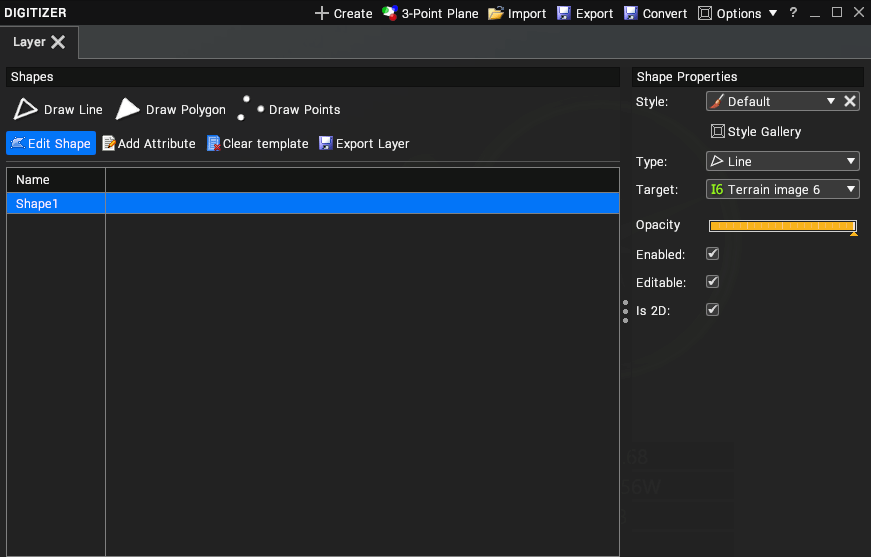
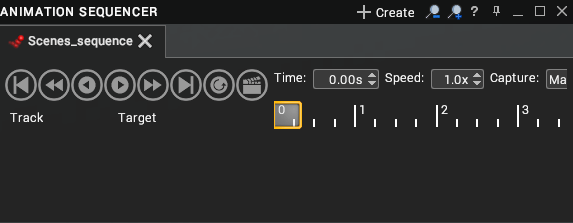
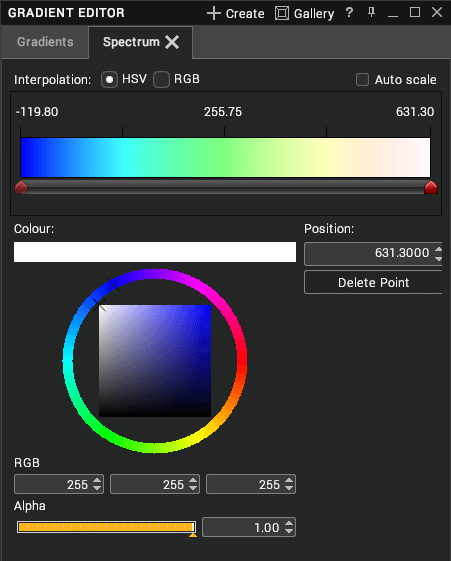
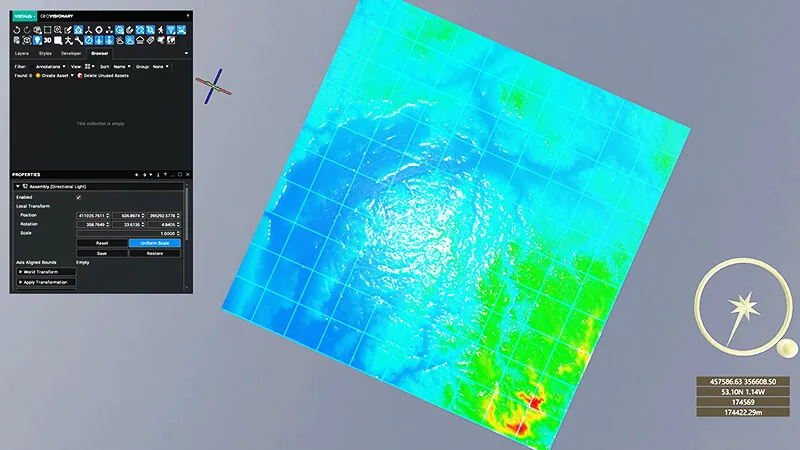
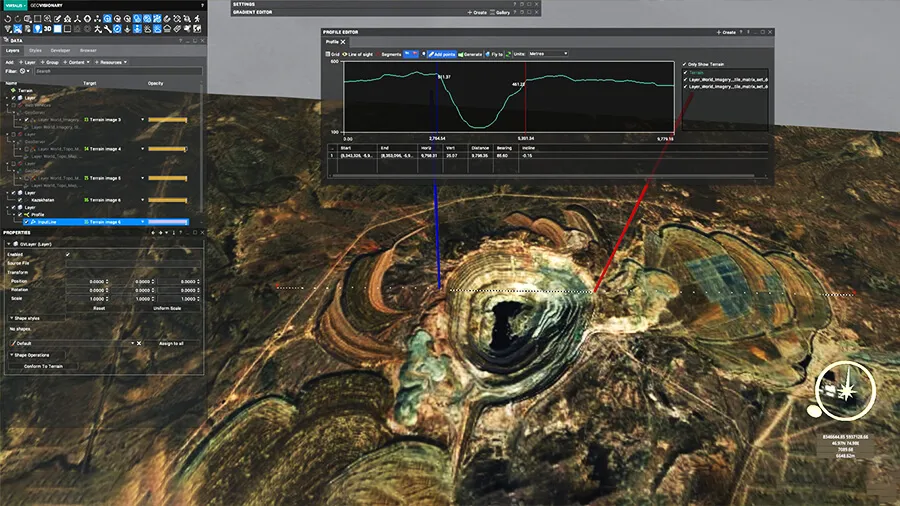
Choose from a wide range of tools to mark up, animate and manipulate your data. Use the gradient editor to create heat maps, add markers to your scene to flag specific points, and include animations like camera movements. Enrich visualisations by connecting to live data feeds from the field.
Present & explore
Display your data in VR and on desktop. No matter the background of your audience, you can communicate complex and multi-layered scenarios broadly and clearly.
You're in control
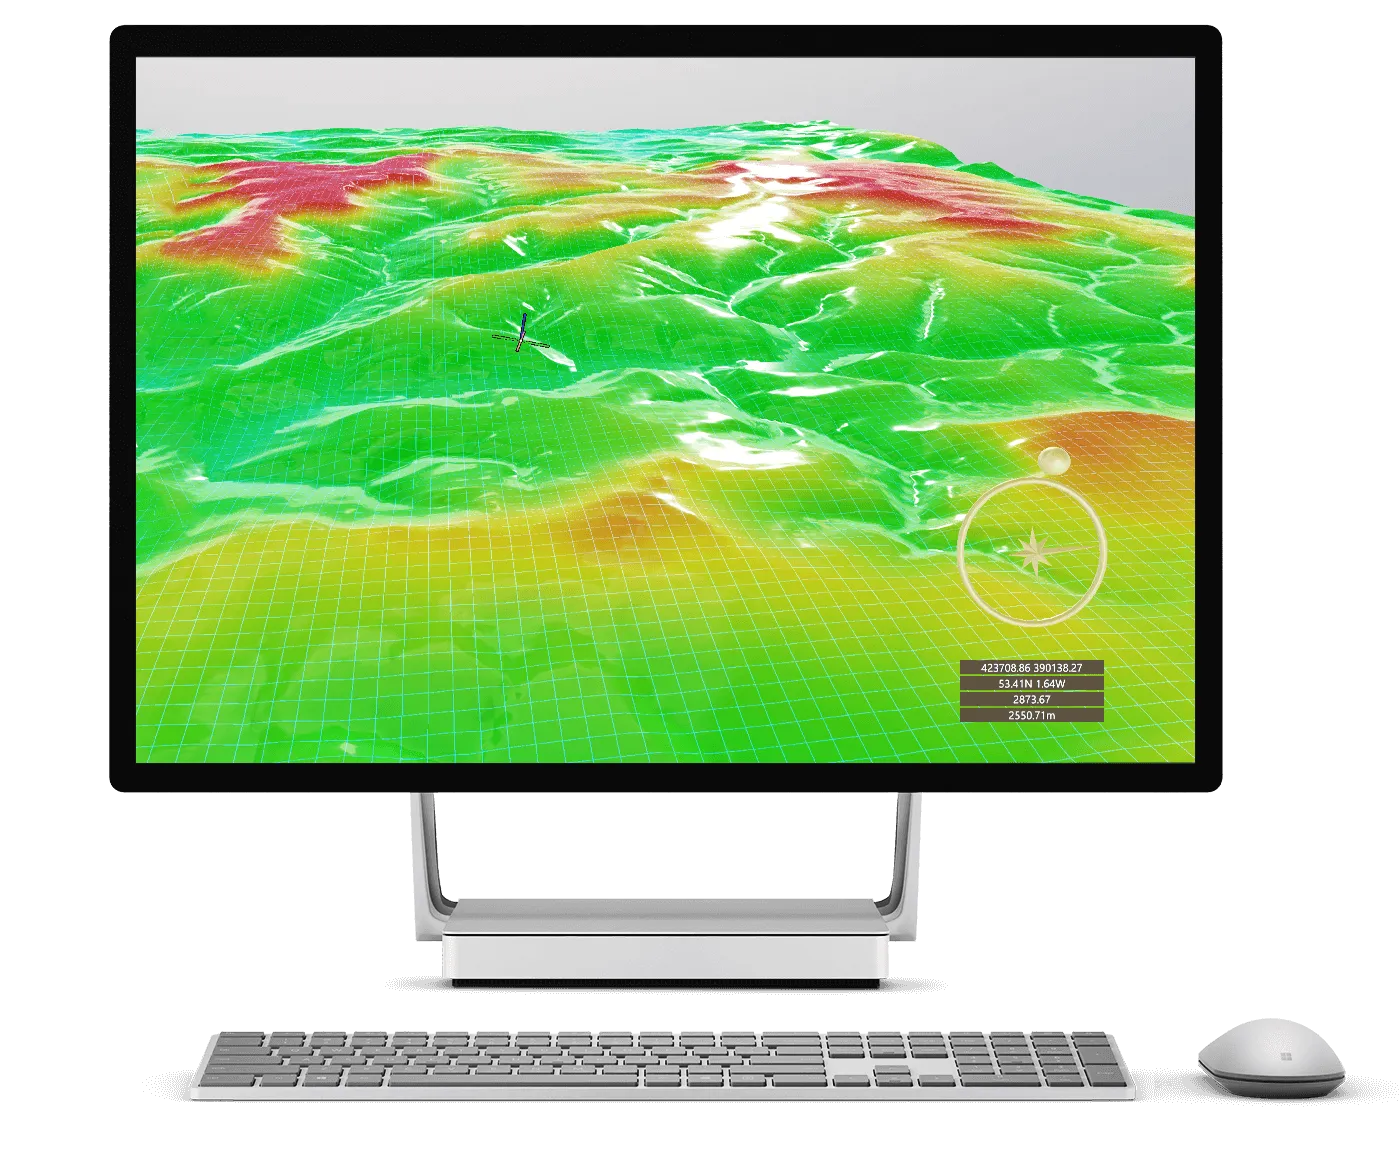
See your environment, region, country or planet in 3D
No Code
Create and manipulate a scene without writing a single line of code.
Visualise & Plan
Combine data sets and allow remote stakeholders to collaborate in the same spatial context.
Monitor
Receive real-time updates from environmental monitoring equipment and databases.
Integrate
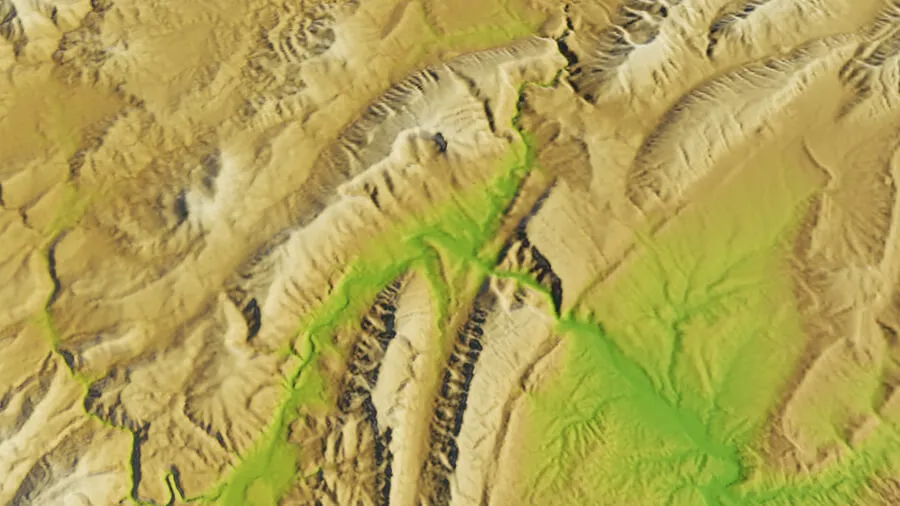
Sync data sets from varying sources and blend multi-resolution terrain to create instant slope and aspect maps.
Data
Bring together point clouds and combine with other data types, including GIS software and LiDAR.
Scene
Measure the orientation of dip slopes and fractures; change terrain illumination and sun direction to enhance ground features.
"These techniques are especially valuable in limited access areas, such as jungles. Extra details were added to the virtual GeoVisionary models using laser scanning techniques prior to model simulation analyses. UNITEN and TNB Grid Maintenance then will be able to monitor the site conditions virtually, over time."
Assoc. Prof. Dr. Rohayu Che Omar | Director at UNITEN’s Institute of Energy Infrastructure
“In both teaching and research within GeoMining we often struggle to understand and communicate the 3D shapes that are in the ground from 2D drawings. VR helps us to visualise. ”
Gustav Jansson | Lulea’s Associate Senior Lecturer in Industrialised Construction
Your business, our expertise. Our software is enabling innovation. Let's chat.
By clicking “Accept All Cookies”, you agree to the storing of cookies on your device to enhance site navigation, analyze site usage, and assist in our marketing efforts. View our Privacy Policy for more information.


.webp)